Division Chart 1–12
A division chart is a multiplication chart read backwards. To work out 24 ÷ 6, find 24 in the 6 row and go up the column: the answer is 4.
Every division fact has a times-table partner: 24 ÷ 6 = 4 because 6 × 4 = 24.
Division chart 1 to 12
Rows are the number you divide by, columns are the answer. Tap any number to see its fact family.
| ÷ | 1 | 2 | 3 | 4 | 5 | 6 | 7 | 8 | 9 | 10 | 11 | 12 |
|---|---|---|---|---|---|---|---|---|---|---|---|---|
| 1 | 1 | 2 | 3 | 4 | 5 | 6 | 7 | 8 | 9 | 10 | 11 | 12 |
| 2 | 2 | 4 | 6 | 8 | 10 | 12 | 14 | 16 | 18 | 20 | 22 | 24 |
| 3 | 3 | 6 | 9 | 12 | 15 | 18 | 21 | 24 | 27 | 30 | 33 | 36 |
| 4 | 4 | 8 | 12 | 16 | 20 | 24 | 28 | 32 | 36 | 40 | 44 | 48 |
| 5 | 5 | 10 | 15 | 20 | 25 | 30 | 35 | 40 | 45 | 50 | 55 | 60 |
| 6 | 6 | 12 | 18 | 24 | 30 | 36 | 42 | 48 | 54 | 60 | 66 | 72 |
| 7 | 7 | 14 | 21 | 28 | 35 | 42 | 49 | 56 | 63 | 70 | 77 | 84 |
| 8 | 8 | 16 | 24 | 32 | 40 | 48 | 56 | 64 | 72 | 80 | 88 | 96 |
| 9 | 9 | 18 | 27 | 36 | 45 | 54 | 63 | 72 | 81 | 90 | 99 | 108 |
| 10 | 10 | 20 | 30 | 40 | 50 | 60 | 70 | 80 | 90 | 100 | 110 | 120 |
| 11 | 11 | 22 | 33 | 44 | 55 | 66 | 77 | 88 | 99 | 110 | 121 | 132 |
| 12 | 12 | 24 | 36 | 48 | 60 | 72 | 84 | 96 | 108 | 120 | 132 | 144 |
Tap a number in the chart.
Division tables 1 to 12
The same 144 facts as lists, one table per divisor.
Divide by 1
- 1 ÷ 1 = 1
- 2 ÷ 1 = 2
- 3 ÷ 1 = 3
- 4 ÷ 1 = 4
- 5 ÷ 1 = 5
- 6 ÷ 1 = 6
- 7 ÷ 1 = 7
- 8 ÷ 1 = 8
- 9 ÷ 1 = 9
- 10 ÷ 1 = 10
- 11 ÷ 1 = 11
- 12 ÷ 1 = 12
Divide by 2
- 2 ÷ 2 = 1
- 4 ÷ 2 = 2
- 6 ÷ 2 = 3
- 8 ÷ 2 = 4
- 10 ÷ 2 = 5
- 12 ÷ 2 = 6
- 14 ÷ 2 = 7
- 16 ÷ 2 = 8
- 18 ÷ 2 = 9
- 20 ÷ 2 = 10
- 22 ÷ 2 = 11
- 24 ÷ 2 = 12
Divide by 3
- 3 ÷ 3 = 1
- 6 ÷ 3 = 2
- 9 ÷ 3 = 3
- 12 ÷ 3 = 4
- 15 ÷ 3 = 5
- 18 ÷ 3 = 6
- 21 ÷ 3 = 7
- 24 ÷ 3 = 8
- 27 ÷ 3 = 9
- 30 ÷ 3 = 10
- 33 ÷ 3 = 11
- 36 ÷ 3 = 12
Divide by 4
- 4 ÷ 4 = 1
- 8 ÷ 4 = 2
- 12 ÷ 4 = 3
- 16 ÷ 4 = 4
- 20 ÷ 4 = 5
- 24 ÷ 4 = 6
- 28 ÷ 4 = 7
- 32 ÷ 4 = 8
- 36 ÷ 4 = 9
- 40 ÷ 4 = 10
- 44 ÷ 4 = 11
- 48 ÷ 4 = 12
Divide by 5
- 5 ÷ 5 = 1
- 10 ÷ 5 = 2
- 15 ÷ 5 = 3
- 20 ÷ 5 = 4
- 25 ÷ 5 = 5
- 30 ÷ 5 = 6
- 35 ÷ 5 = 7
- 40 ÷ 5 = 8
- 45 ÷ 5 = 9
- 50 ÷ 5 = 10
- 55 ÷ 5 = 11
- 60 ÷ 5 = 12
Divide by 6
- 6 ÷ 6 = 1
- 12 ÷ 6 = 2
- 18 ÷ 6 = 3
- 24 ÷ 6 = 4
- 30 ÷ 6 = 5
- 36 ÷ 6 = 6
- 42 ÷ 6 = 7
- 48 ÷ 6 = 8
- 54 ÷ 6 = 9
- 60 ÷ 6 = 10
- 66 ÷ 6 = 11
- 72 ÷ 6 = 12
Divide by 7
- 7 ÷ 7 = 1
- 14 ÷ 7 = 2
- 21 ÷ 7 = 3
- 28 ÷ 7 = 4
- 35 ÷ 7 = 5
- 42 ÷ 7 = 6
- 49 ÷ 7 = 7
- 56 ÷ 7 = 8
- 63 ÷ 7 = 9
- 70 ÷ 7 = 10
- 77 ÷ 7 = 11
- 84 ÷ 7 = 12
Divide by 8
- 8 ÷ 8 = 1
- 16 ÷ 8 = 2
- 24 ÷ 8 = 3
- 32 ÷ 8 = 4
- 40 ÷ 8 = 5
- 48 ÷ 8 = 6
- 56 ÷ 8 = 7
- 64 ÷ 8 = 8
- 72 ÷ 8 = 9
- 80 ÷ 8 = 10
- 88 ÷ 8 = 11
- 96 ÷ 8 = 12
Divide by 9
- 9 ÷ 9 = 1
- 18 ÷ 9 = 2
- 27 ÷ 9 = 3
- 36 ÷ 9 = 4
- 45 ÷ 9 = 5
- 54 ÷ 9 = 6
- 63 ÷ 9 = 7
- 72 ÷ 9 = 8
- 81 ÷ 9 = 9
- 90 ÷ 9 = 10
- 99 ÷ 9 = 11
- 108 ÷ 9 = 12
Divide by 10
- 10 ÷ 10 = 1
- 20 ÷ 10 = 2
- 30 ÷ 10 = 3
- 40 ÷ 10 = 4
- 50 ÷ 10 = 5
- 60 ÷ 10 = 6
- 70 ÷ 10 = 7
- 80 ÷ 10 = 8
- 90 ÷ 10 = 9
- 100 ÷ 10 = 10
- 110 ÷ 10 = 11
- 120 ÷ 10 = 12
Divide by 11
- 11 ÷ 11 = 1
- 22 ÷ 11 = 2
- 33 ÷ 11 = 3
- 44 ÷ 11 = 4
- 55 ÷ 11 = 5
- 66 ÷ 11 = 6
- 77 ÷ 11 = 7
- 88 ÷ 11 = 8
- 99 ÷ 11 = 9
- 110 ÷ 11 = 10
- 121 ÷ 11 = 11
- 132 ÷ 11 = 12
Divide by 12
- 12 ÷ 12 = 1
- 24 ÷ 12 = 2
- 36 ÷ 12 = 3
- 48 ÷ 12 = 4
- 60 ÷ 12 = 5
- 72 ÷ 12 = 6
- 84 ÷ 12 = 7
- 96 ÷ 12 = 8
- 108 ÷ 12 = 9
- 120 ÷ 12 = 10
- 132 ÷ 12 = 11
- 144 ÷ 12 = 12
Practice: division facts
Press Enter to check. Facts from ÷2 to ÷12.
How to use a division chart
- Find the number you divide by (the divisor) in the left column.
- Go along that row until you reach the number being divided (the dividend).
- Go straight up to the top row. That number is the answer (the quotient).
If the number isn’t in the row, the division has a remainder: for 26 ÷ 6, the closest number below 26 in the 6 row is 24, so 26 ÷ 6 = 4 remainder 2. That is the first step of long division.
Patterns that make division easier
- ÷ 1 leaves a number the same, and any number divided by itself is 1.
- ÷ 2 is halving. ÷ 4 is halving twice: 48 → 24 → 12.
- ÷ 5: numbers ending in 0 or 5 divide evenly; double the number and drop the zero (35 → 70 → 7).
- ÷ 10: take the zero off the end: 70 ÷ 10 = 7.
- ÷ 9: the digits of every number in the 9 row add up to 9 (54: 5 + 4).
The quickest route to division facts is knowing the times tables, which is why the multiplication chart and this chart are the same grid.
Printable division charts
Free PDFs. The blank chart has the filled version on page 2 to check.
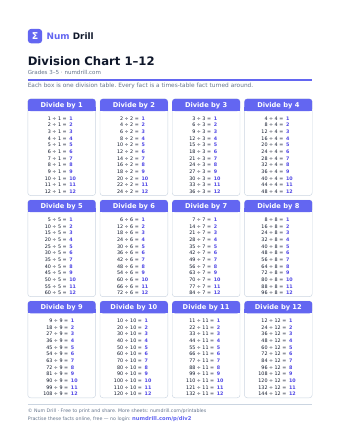
Division Chart 1–12
Grades 3–5
Every division table from ÷1 to ÷12 on one page, 144 facts.
Download PDF (47 KB)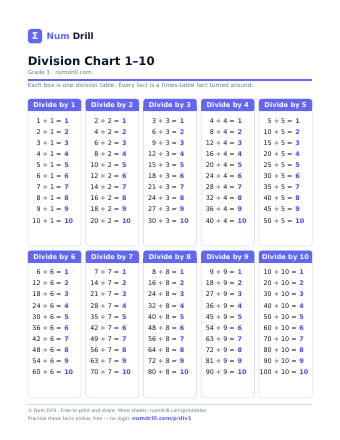
Division Chart 1–10
Grade 3
The ÷1 to ÷10 tables in larger type, for younger learners.
Download PDF (46 KB)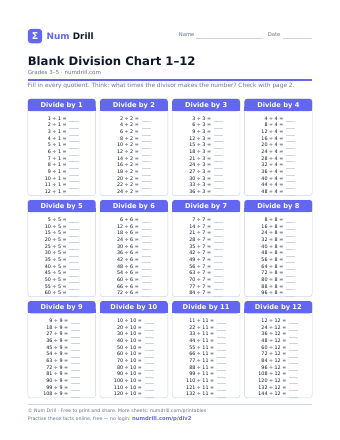
Blank Division Chart 1–12
Grades 3–5
All 144 division facts with the answers missing. Filled chart on page 2 to check.
Download PDF (53 KB)For practice sheets, see the division worksheets: facts, long division and word problems.
When kids learn it
Division facts are a 3rd grade standard: by the end of 3rd grade, students should divide within 100 fluently, using the link between multiplication and division. In 4th grade the facts carry into long division. See 3rd grade math practice and division facts practice.
Common questions
How do you read a division chart?
Find the divisor in the left column, go along its row to the number you are dividing, then go up to the top row for the answer. For 24 ÷ 6, find 24 in the 6 row; the top of that column is 4.
What is the difference between a division chart and a multiplication chart?
They are the same grid read in opposite directions. A multiplication chart takes row and column to the product; a division chart starts from the product and finds the missing factor.
What are the division tables?
The division facts for one divisor, like 2 ÷ 2 = 1, 4 ÷ 2 = 2 up to 24 ÷ 2 = 12. There are 12 tables from ÷1 to ÷12, 144 facts in all.
What grade learns division facts?
3rd grade. Students should know division within 100 fluently by the end of the year, using the times tables they learn at the same time.
Related: multiplication chart · division worksheets · division facts practice · long division practice · all printable worksheets